AI Trading Coaching
How an AI Trading Coach Finds Patterns in Your Journal Data
See the actual mechanics behind AI journal pattern detection -- correlation, clustering, sequence detection, and outlier flags, all on your own trade history.
How an AI Trading Coach Finds Patterns in Your Journal Data
AI Trading Coach for Prop Firm Traders: What It Should and Should Not Do covers the boundaries of what an AI coaching tool should and should not claim. This article goes one level deeper into a narrower question: mechanically, how does a tool actually find a pattern in a trader’s journal data in the first place? Understanding the mechanics makes it much easier to judge whether a specific pattern claim is trustworthy or just an impressive-sounding guess.
The Raw Material: What Data an AI Coach Actually Looks At
Pattern detection starts with structured data, not vibes. A useful trading journal already contains most of what is needed: setup name, planned risk, entry and exit details, rule-compliance markers, emotional tags, session and time information, and the eventual outcome of the trade.
None of this is market data. It is entirely the trader’s own recorded history. This matters because it defines the ceiling of what any pattern-finding process can honestly claim: it can describe relationships within a trader’s own past behavior. It cannot describe or predict what the market will do next, because market direction was never part of the input.
From Individual Trades to a Structured Dataset
A single trade entry is just one row of data. Pattern detection becomes possible once many rows accumulate and can be compared against each other. This is why journal consistency matters more than any individual entry’s detail: a tool cannot find a pattern across ten trades if only three were logged with full tags.
Once enough entries exist, the trade log functions like a small dataset with columns such as setup, session, emotional tag, rule-compliance flag, and outcome. Every pattern-finding method described below is really just a different way of asking a question across those columns.
Pattern-Finding Method 1: Correlation Between Tags and Outcomes
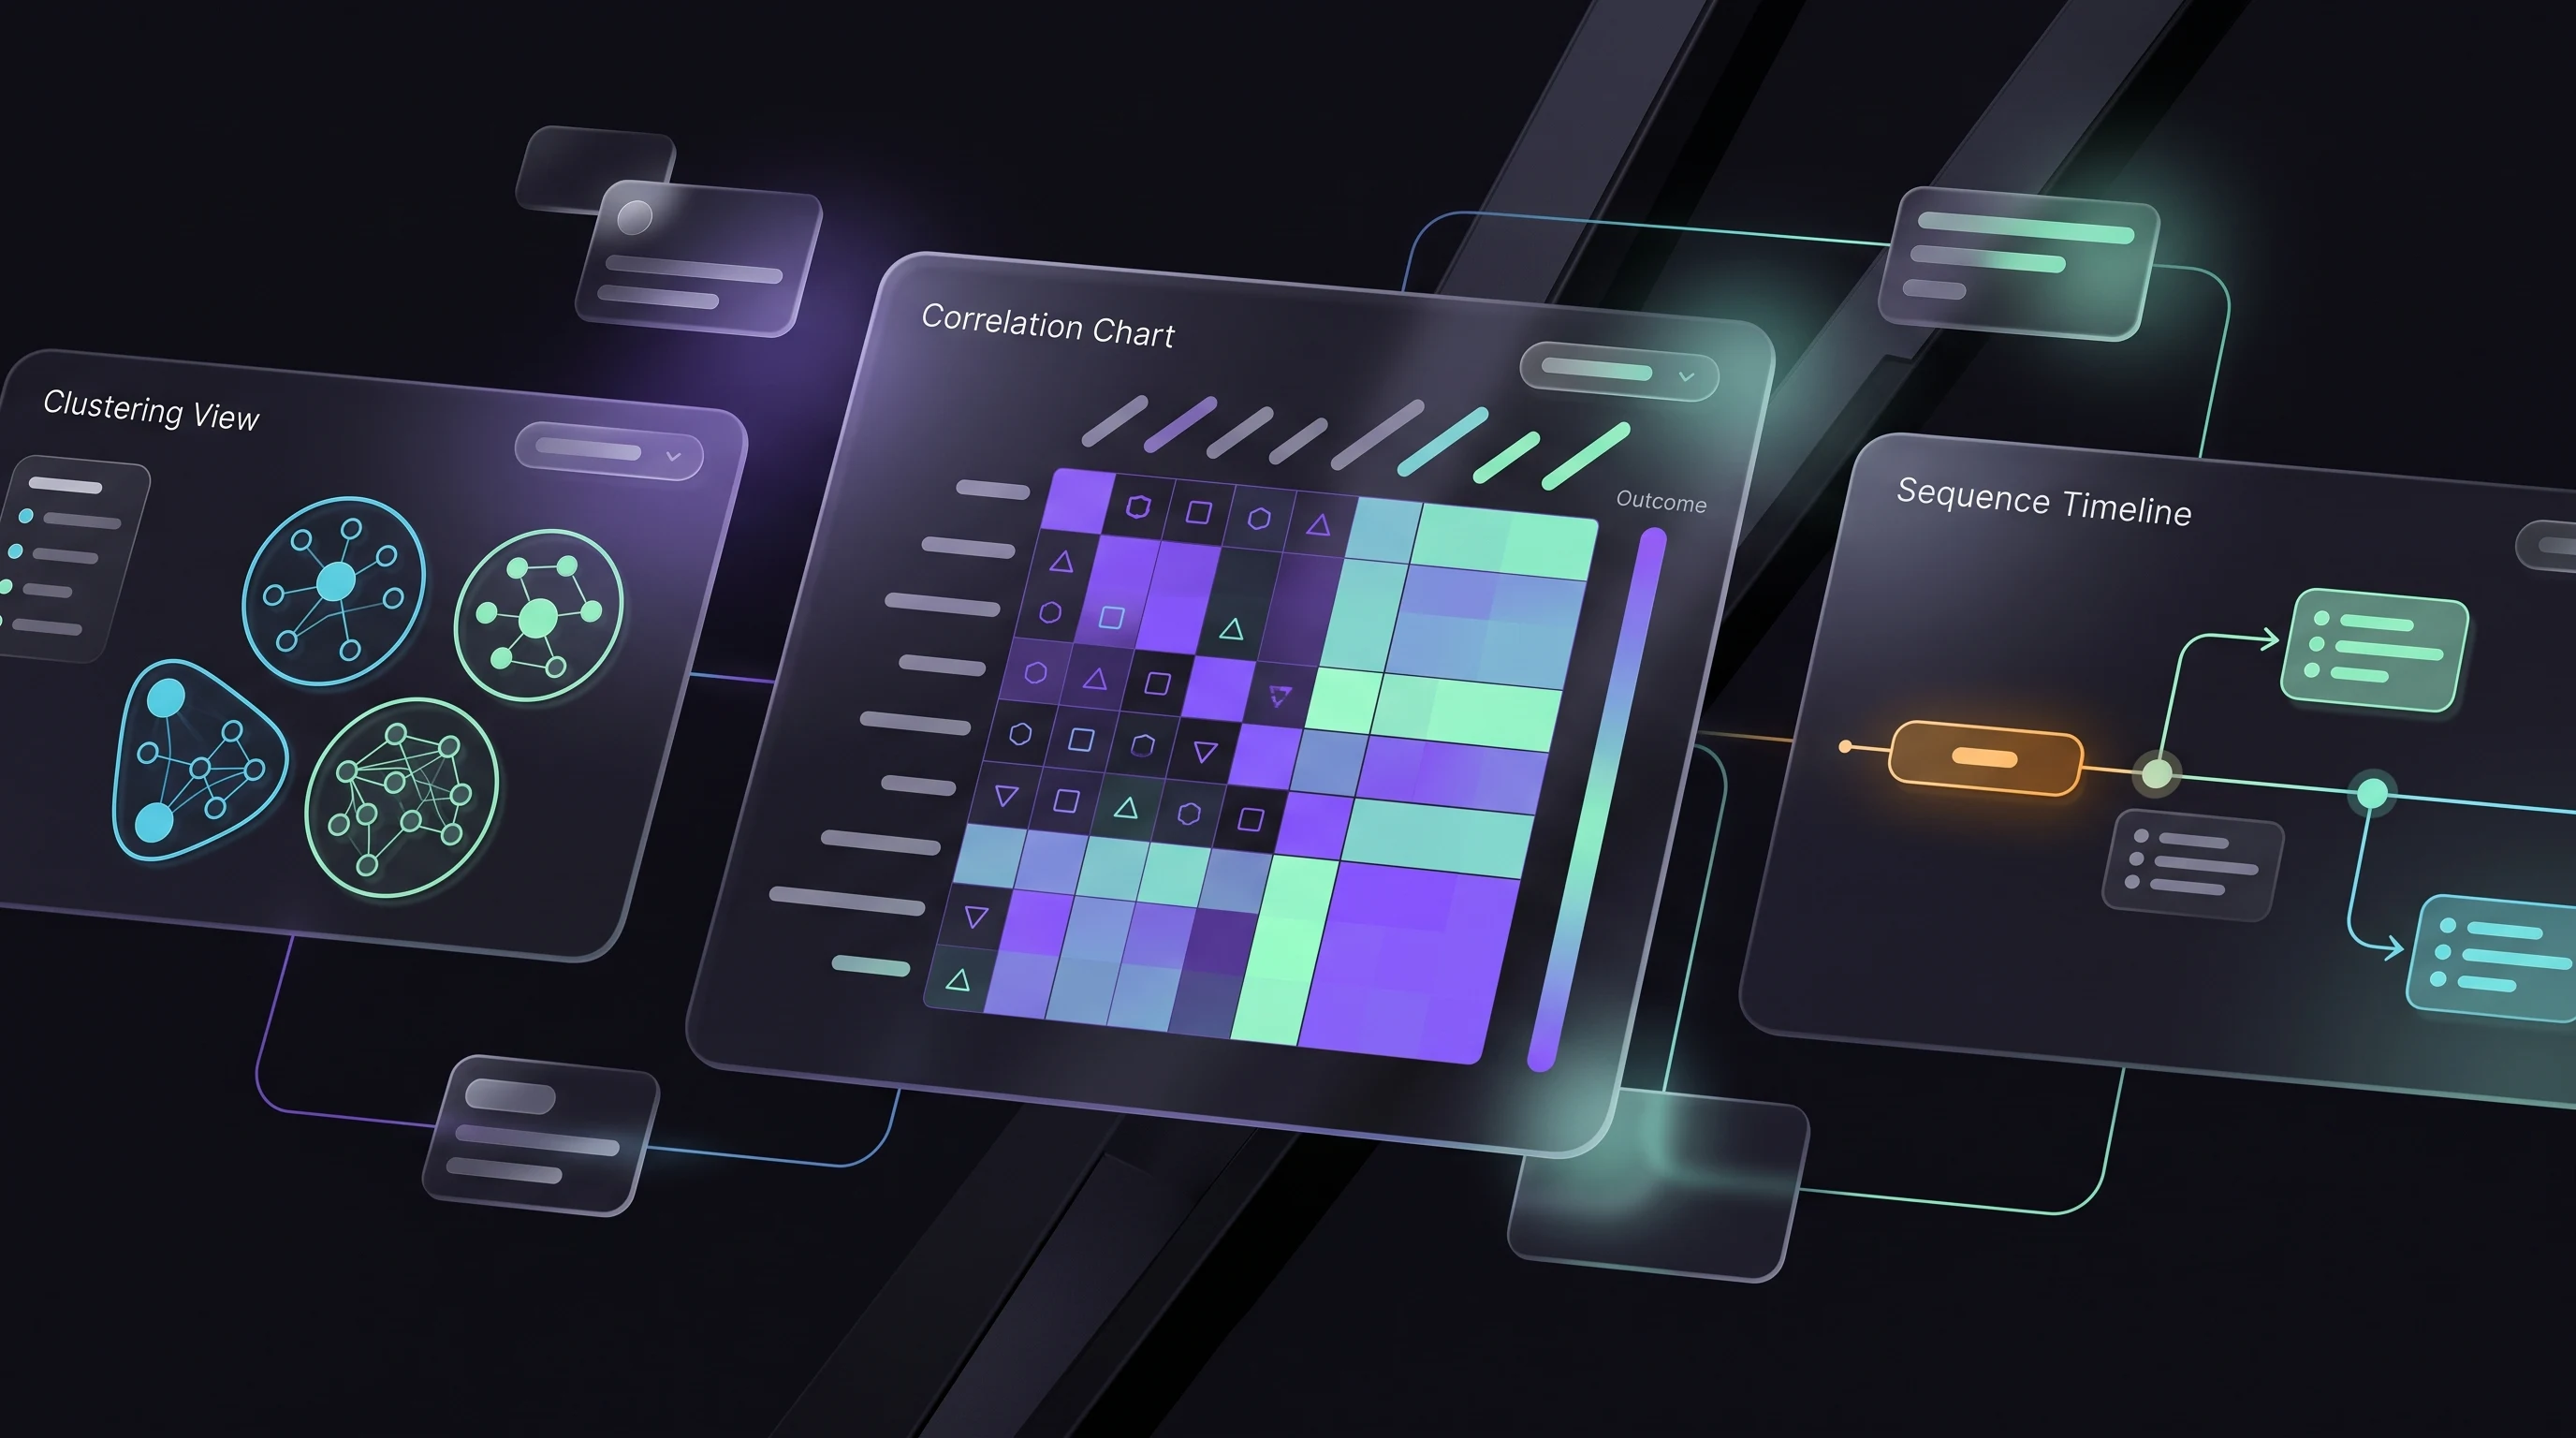
The simplest method looks for a relationship between one field and another. For example: do trades tagged “rushed” have a different average outcome than trades tagged “calm”? Do trades where a rule was broken cluster around a different result distribution than compliant trades?
This is descriptive statistics, not prediction. The output is a factual statement about the trader’s own recorded history, such as “trades tagged frustrated in this dataset showed a lower rule-compliance rate.” It is not a claim that frustration causes losses in general, only that this specific relationship shows up in this specific trader’s own logged trades.
Pattern-Finding Method 2: Clustering by Time, Session, or Setup
A second method groups trades by shared context rather than by a single tag. Trades can be clustered by session (London, New York, Asian), by setup name, by day of week, or by proximity to a daily loss limit.
Clustering answers a different kind of question than correlation: not “does tag X relate to outcome Y,” but “do trades that share this context behave differently as a group than trades that don’t.” A trader might discover that late-session trades cluster around lower setup-quality ratings, or that trades taken close to a daily loss limit cluster around larger position sizes than planned.
Pattern-Finding Method 3: Sequence Detection
Sequence detection looks specifically at what tends to happen after a given event, rather than at trades in isolation. A common question in this category: what does the next trade tend to look like after a loss, after two consecutive losses, or after a rule break?
This is the method most directly relevant to patterns like revenge trading or overtrading, since both are fundamentally about what changes in behavior after a specific triggering event. Sequence detection does not judge whether the next trade was good or bad on its own. It compares the trade that follows a trigger event against the trader’s normal baseline behavior.
Pattern-Finding Method 4: Outlier and Deviation Detection
The fourth method flags entries that deviate meaningfully from a trader’s own typical pattern, such as a position size several times larger than usual, a session with an unusually high trade count, or a day where multiple rule-compliance fields were marked no in a row.
Outlier detection is useful because meaningful process breaks are often visible as deviations from a trader’s own baseline, even before a clear behavioral tag has been applied. It surfaces days or trades worth a closer manual look rather than delivering a final conclusion on its own.
A Simple Worked Example
Suppose a trader has logged 80 trades over two months, each tagged with an emotional state before entry and a rule-compliance flag. A sequence-detection pass might ask: what happens on the trade immediately following a loss, compared to the trader’s overall average?
Say the trader’s overall rule-compliance rate across all 80 trades is 75%. Looking only at the 22 trades that directly followed a loss, the compliance rate drops to 45%. That gap — 75% overall versus 45% immediately after a loss — is a specific, checkable claim. It points to a concrete review question: what changes in the ten or fifteen minutes after a losing trade that makes a written rule harder to follow?
Notice what this example does not do. It does not say the trader is undisciplined in general. It does not predict the next losing trade or suggest a specific fix. It isolates one narrow, well-defined slice of the trader’s own history and reports the number honestly, including the sample size behind it (22 trades, not 200), so the trader can judge for themselves how much weight the finding deserves.
Why Sample Size Matters for Any Pattern Claim
Every one of these methods produces more reliable output as the underlying sample grows. A correlation based on five trades is close to meaningless. The same correlation based on two hundred tagged trades across several months is a much more solid basis for review.
This is a genuine limitation, not a caveat added for legal safety. A responsible AI coaching tool should be explicit about sample size when presenting a pattern, and a trader reviewing any pattern claim should ask how many trades it is actually based on before treating it as settled.
How to Verify a Pattern Instead of Just Trusting It
A pattern claim is more trustworthy when it comes with enough detail to check manually. Reasonable questions to ask of any AI-surfaced pattern include:
- How many trades is this based on?
- Can I see the specific trades that make up this pattern, not just the summary?
- Does the pattern hold up if I look at a different time window?
- Is this describing my behavior, or making a claim about what I should do next?
A tool that can answer the first three questions clearly, and that stays firmly on the “describing behavior” side of the fourth, is behaving the way a journal-based pattern-finding tool should. A “black box” answer with no way to inspect the underlying trades is a reasonable point to slow down and ask more questions.
What This Process Cannot Do
None of the four methods above involve market data, price forecasting, or any claim about future price direction. They operate entirely on a trader’s own historical journal entries. That means this kind of pattern detection cannot tell a trader whether a specific trade idea will work, cannot predict news events or volatility, and cannot guarantee that acting on a surfaced pattern will improve results going forward. It can only describe what has already happened in a trader’s own recorded history, as a starting point for the trader’s own review.
How Propol AI Coach Applies This
Propol AI Coach, inside PropLog AI, applies these same categories of analysis — correlation, clustering, sequence, and outlier detection — to a trader’s own journal entries, tags, and P&L history. Where possible, it is designed to surface the underlying trades behind a pattern rather than only a summary conclusion, so a trader can check the claim rather than simply accept it.
It does not issue signals, does not forecast the market, and does not present any pattern as a guarantee of future performance. Its role stops at making a trader’s own recorded behavior easier to see clearly — a boundary explored further in a companion piece on why AI trading coaches should not give buy or sell signals, and in a closer look at how Propol AI Coach specifically helps traders find mistakes that are easy to miss on their own. For traders weighing whether an AI layer is worth adding to a spreadsheet-based process, that comparison is also worth exploring separately.
Conclusion
An AI trading coach that is worth trusting is one whose pattern-finding methods can be explained in plain language: it compares tags to outcomes, groups trades by shared context, looks at what follows specific trigger events, and flags entries that deviate from a trader’s own baseline. All of it runs on the trader’s own journal data, all of it improves with a larger sample, and none of it involves predicting where the market goes next. Understanding the mechanics is the fastest way to tell a genuinely useful review tool from one that just sounds impressive.
Start your trading journal
Track trades, understand your psychology, and get personalized AI coaching. No signals, no financial advice — just better self-review from your own data.
Get Started Free