Performance Analytics
Trading Expectancy Calculator: Check Your Average Result per Trade
Calculate historical trading expectancy from your winning trades, losing trades, average win, and average loss using a clear USD example.
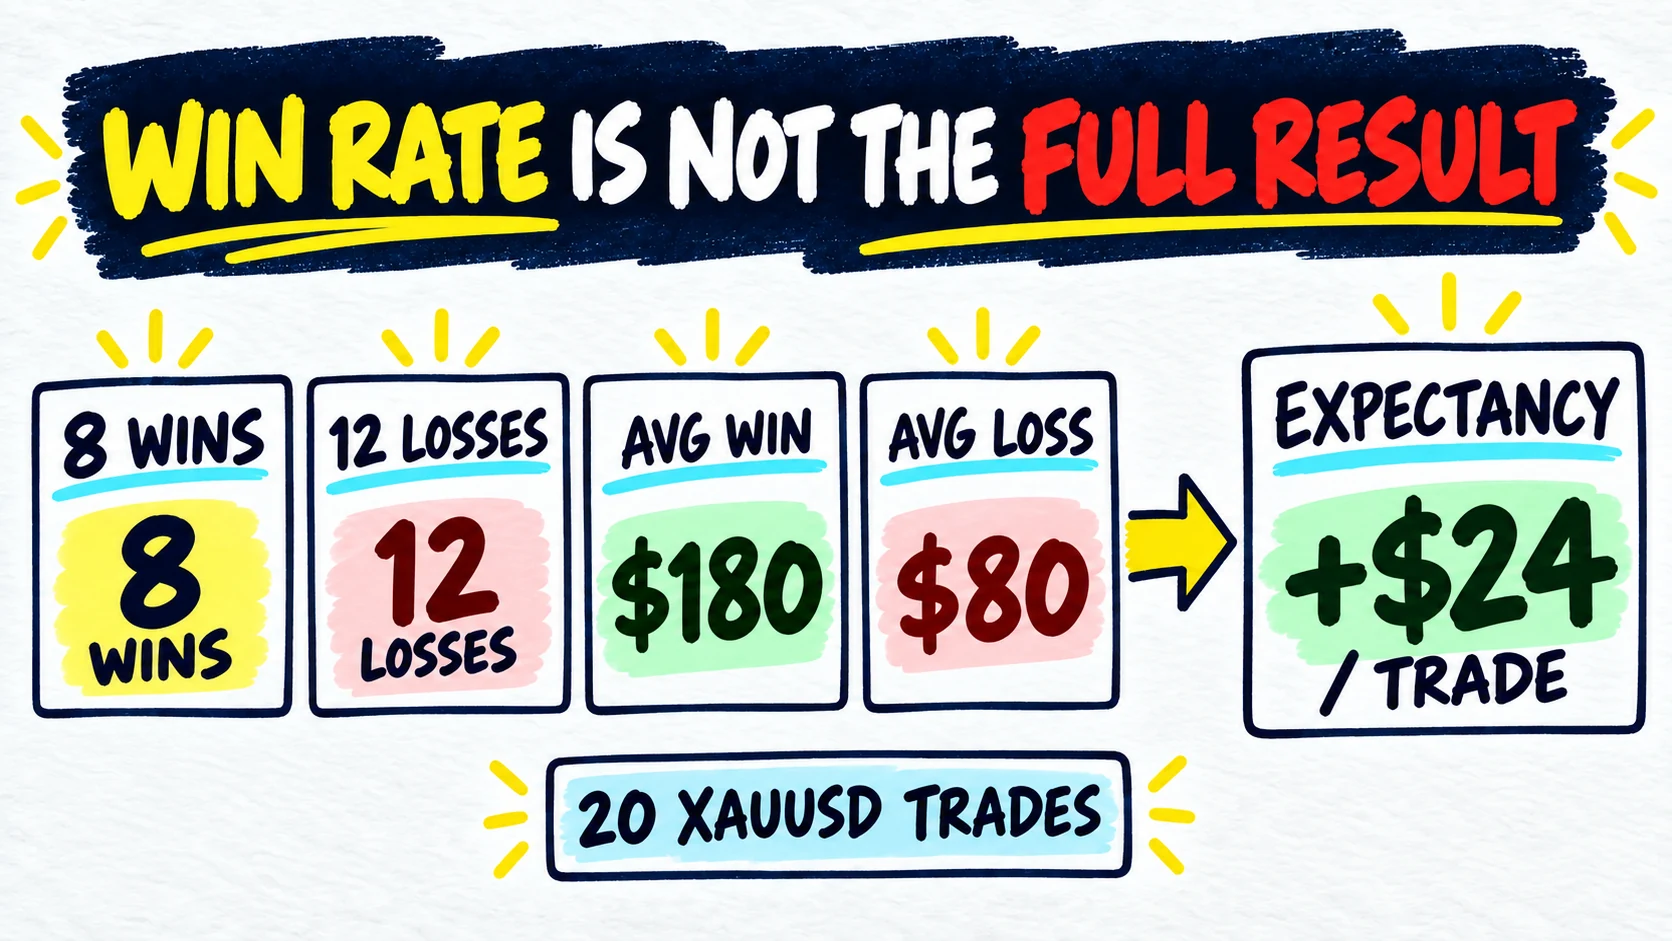
You check your journal and see a 40% win rate. You may feel that you are losing too often.
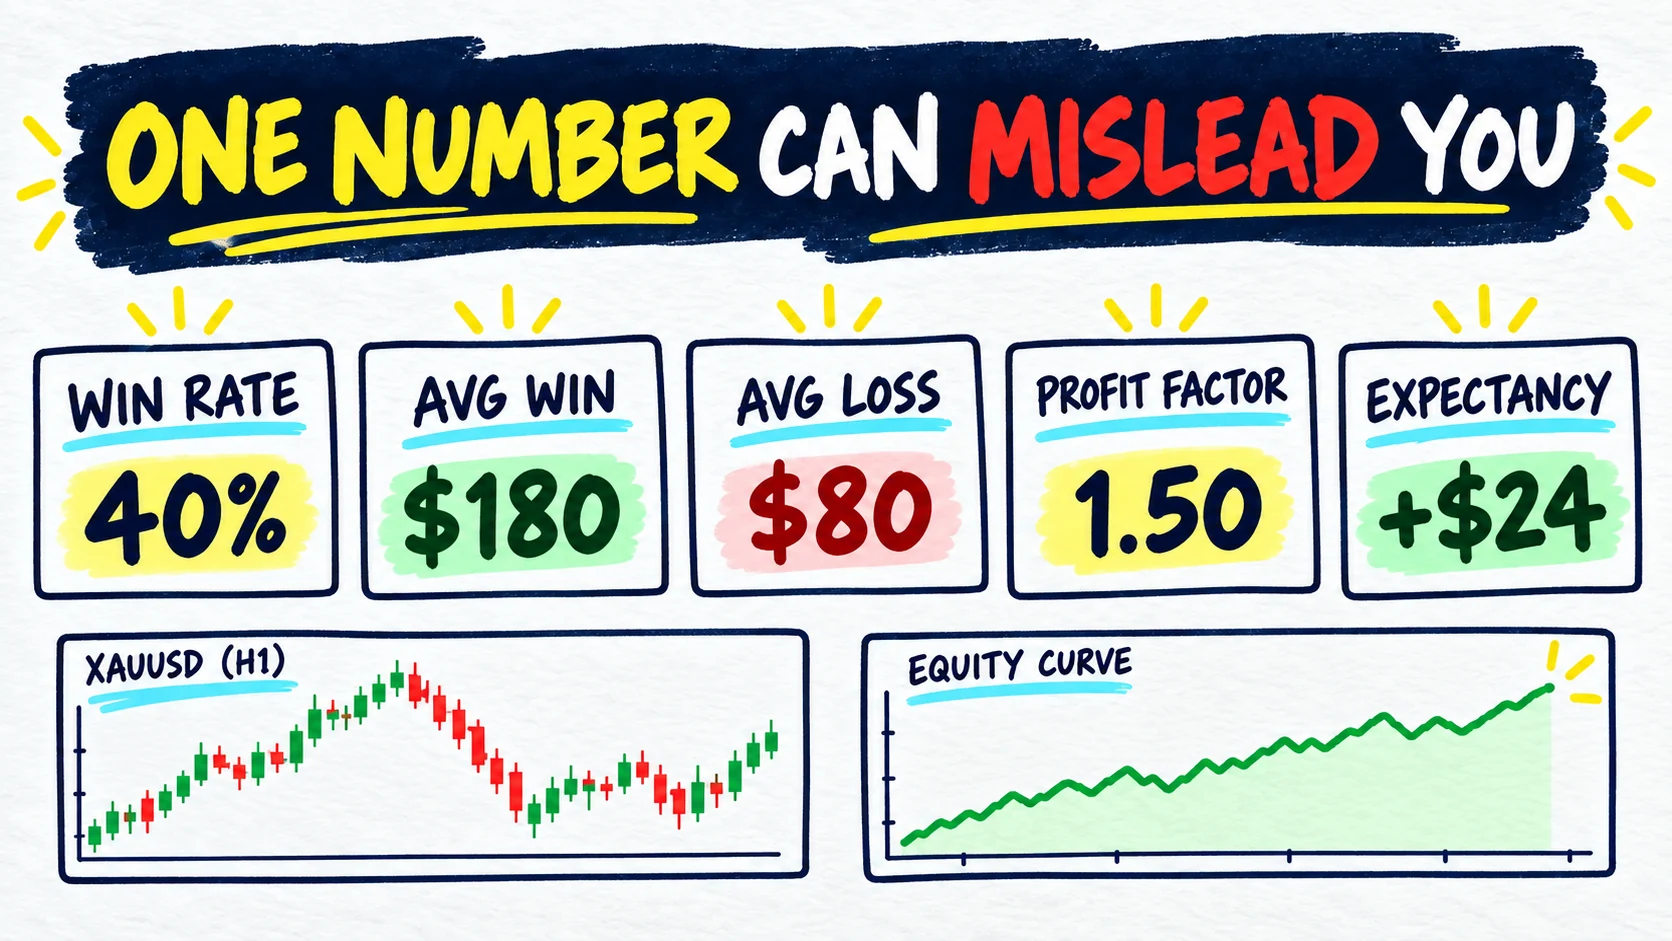
But win rate does not show how large your wins and losses were. If your average winning trade was $180 and your average losing trade was $80, the same 40% win rate could still finish positive.
Quick answer: trading expectancy is the average net result per trade across the sample you entered. Calculate the total winning amount, subtract the total losing amount, then divide by all closed trades—including breakeven trades when you count them in the sample.
Use the calculator below with one clean group of closed trades. Keep the account, date range, currency, and cost treatment the same.
Use one clean group of closed trades
Trading expectancy calculator
Enter trade counts and average net results from the same sample. The calculator shows the historical average result per trade.
This entered sample averaged +$24.00 per closed trade. It does not predict the next trade.
($1,440.00 − $960.00) ÷ 20 = +$24.00 per trade (40.00% × $180.00) − (60.00% × $80.00) = +$24.00 The result is a historical average. It does not say what your next trade will do. Use the wider trading performance metrics guide when you want to read expectancy with profit factor, drawdown, and the equity curve.
What does the calculator need from you?
The calculator asks for five inputs.
Winning trades
Count the closed trades with a positive net result.
If you scaled out of one position in several parts, use the same counting rule across the sample. Do not count partial exits as separate trades in one report and as one trade in another.
Losing trades
Count the closed trades with a negative net result.
The calculator derives the win rate and loss rate from your counts. You do not need to calculate either percentage first.
Breakeven trades
A breakeven trade contributes $0 to the total result, but it still counts as a closed trade when it is included in your sample.
For example, if you recorded 8 wins, 10 losses, and 2 breakeven trades, the total is still 20 trades. The breakeven trades make the average smaller because the same net result is divided across more trades.
Use the counting rule already used by your journal or broker statement. If a tiny gain after costs is marked as a win in one place and breakeven in another, clean that difference before comparing reports.
Average net win
This is the total net amount from winning trades divided by the number of winning trades.
Use the average win and average loss from the same sample. Enter the USD amount after any trading costs already included in your journal record.
Average net loss
Enter the average losing amount as a positive number. If the average losing trade was −$80, enter 80.
The calculator subtracts that loss. Entering −80 would reverse the sign and give the wrong answer.
What is the trading expectancy formula?
The totals method is the clearest when you have trade counts:
Historical expectancy per trade
= (total winning amount − total losing amount) ÷ total closed trades
You can cross-check it with rates:
Expectancy
= (win rate × average win) − (loss rate × average loss)
Both formulas should reach the same answer when they use the same trades, units, and costs. Breakeven trades contribute zero, but they remain in the total-trade denominator and affect the win and loss rates.
A 20-trade XAUUSD example
Imagine a fictional journal contains 20 closed XAUUSD trades:
- 8 winning trades;
- 12 losing trades;
- 0 breakeven trades;
$180average net win; and$80average net loss.
The journal tags include London-session liquidity-sweep setups and New York-session breakout setups. Those labels help organise the example. They do not recommend a setup or session.
First calculate the winning and losing totals:
8 × $180 = $1,440 total winning amount
12 × $80 = $960 total losing amount
Then calculate the net result:
$1,440 − $960 = +$480
Finally, divide the result across all 20 trades:
+$480 ÷ 20 = +$24 per trade
The rate-based formula gives the same answer:
(40% × $180) − (60% × $80)
= $72 − $48
= +$24 per trade
The calculation describes these 20 trades. It does not mean trade 21 should make $24.
How do breakeven trades change expectancy?
Suppose the same +$480 net result came from 8 wins, 10 losses, and 2 breakeven trades.
The total remains 20 trades, so the totals method is still:
+$480 ÷ 20 = +$24 per trade
The rates change to 40% wins, 50% losses, and 10% breakeven. The two breakeven trades add zero to the result, but they are part of the selected sample.
This is why you should not silently remove breakeven trades from one report and include them in another. Choose one clear rule and keep it consistent.
What does a positive, zero, or negative result mean?
Read the sign as a description of the entered sample:
| Result from the entered sample | Plain-English meaning | What it does not prove |
|---|---|---|
| Positive | The selected trades averaged a net gain per trade | That the next trade or a future group will be profitable |
| Zero | The selected trades averaged no net gain or loss per trade | That the trading process had no risk or drawdown |
| Negative | The selected trades averaged a net loss per trade | That one setup, session, or decision alone caused the result |
Avoid turning one result into a universal label. A small sample can move sharply when one unusual trade is added or removed.
Expectancy, win rate, and profit factor are different
These three measurements use related information, but they answer different questions.
| Metric | Main question |
|---|---|
| Win rate | How many closed trades finished positive? |
| Expectancy | What was the average net result per trade? |
| Profit factor | How large was the total winning amount compared with the total losing amount? |
In the fictional example, profit factor is:
$1,440 ÷ $960 = 1.50
The calculator shows profit factor only as a cross-check. When the entered sample has no losing amount, it displays Not available because dividing by zero would not produce a useful ratio.
Common expectancy calculation mistakes
Mixing different trade groups
Do not use the win count from September and average win from August. Every input must come from the same sample.
Mixing gross and net results
If the average win includes costs but the average loss does not, the comparison is inconsistent. Use net results when possible and do not subtract a cost twice.
Entering the average loss as a negative number
The formula already subtracts the loss. Enter its magnitude as a positive amount.
Removing breakeven trades without saying so
Changing the denominator changes the average. Record how you counted breakeven outcomes.
Treating a small sample as proof
Twenty trades can explain the formula and show a question worth reviewing. They may not represent different conditions, sessions, or normal losing runs.
Projecting the result into future income
Multiplying +$24 by a future number of trades creates a scenario, not a promise. The next sample may have different costs, trade sizes, decisions, or market conditions. This calculator deliberately does not project monthly or quarterly profit.
How should you use expectancy in a review?
Use the number as the beginning of a review question.
- Confirm the trades and costs included.
- Check whether one result created a large part of the total.
- Compare planned and unplanned trades.
- Compare setups or sessions only when each group has consistent tags.
- Inspect the drawdown and trade order instead of reading the average alone.
- Write one question to check in the next review.
The trading journal template helps you record the fields needed for this calculation. The prop firm trading journal guide explains how to keep those records useful over time.
Use the weekly trading review template for a short check. Use the monthly trading review template when you want a wider sample and period comparison.
How PropLogAI fits into this calculation
PropLogAI displays performance measurements from logged trade data, including win rate, profit factor, average R, and an equity curve.
The calculator on this page helps you understand one historical average. It does not replace the raw trades behind the number, confirm a prop-firm rule, or decide whether you should take another trade.
Frequently asked questions
Is trading expectancy a prediction?
No. It is an average calculated from the trades or scenario entered. It cannot predict one future trade or guarantee that a future sample will behave the same way.
Can a 40% win rate have positive expectancy?
Yes. In the fictional example, 8 wins averaging $180 and 12 losses averaging $80 produce +$24 per trade across the 20-trade sample.
Should I include spread and commission?
Use net trade results when available. If costs are already included in each result, do not deduct them again.
Do breakeven trades count?
They count when they are part of your chosen closed-trade sample. They contribute $0 but remain in the total used to calculate the average.
Why does profit factor show Not available when there are no losses?
Profit factor divides total winning amount by total losing amount. A zero losing amount cannot be used as the divisor, so the calculator avoids displaying zero or infinity.
What is a good trading expectancy?
There is no universal number that is good for every trader, instrument, cost structure, trade size, or sample. First check that the data is clean, then read expectancy with the other metrics and the path of the results.
Start your trading journal
Track trades, understand your psychology, and get personalized AI coaching. No signals, no financial advice — just better self-review from your own data.
Get Started Free