Performance Analytics
Trading Performance Metrics: How to Read Your Numbers Together
Learn how to read win rate, average win and loss, profit factor, expectancy, drawdown, and your equity curve using one simple XAUUSD example.
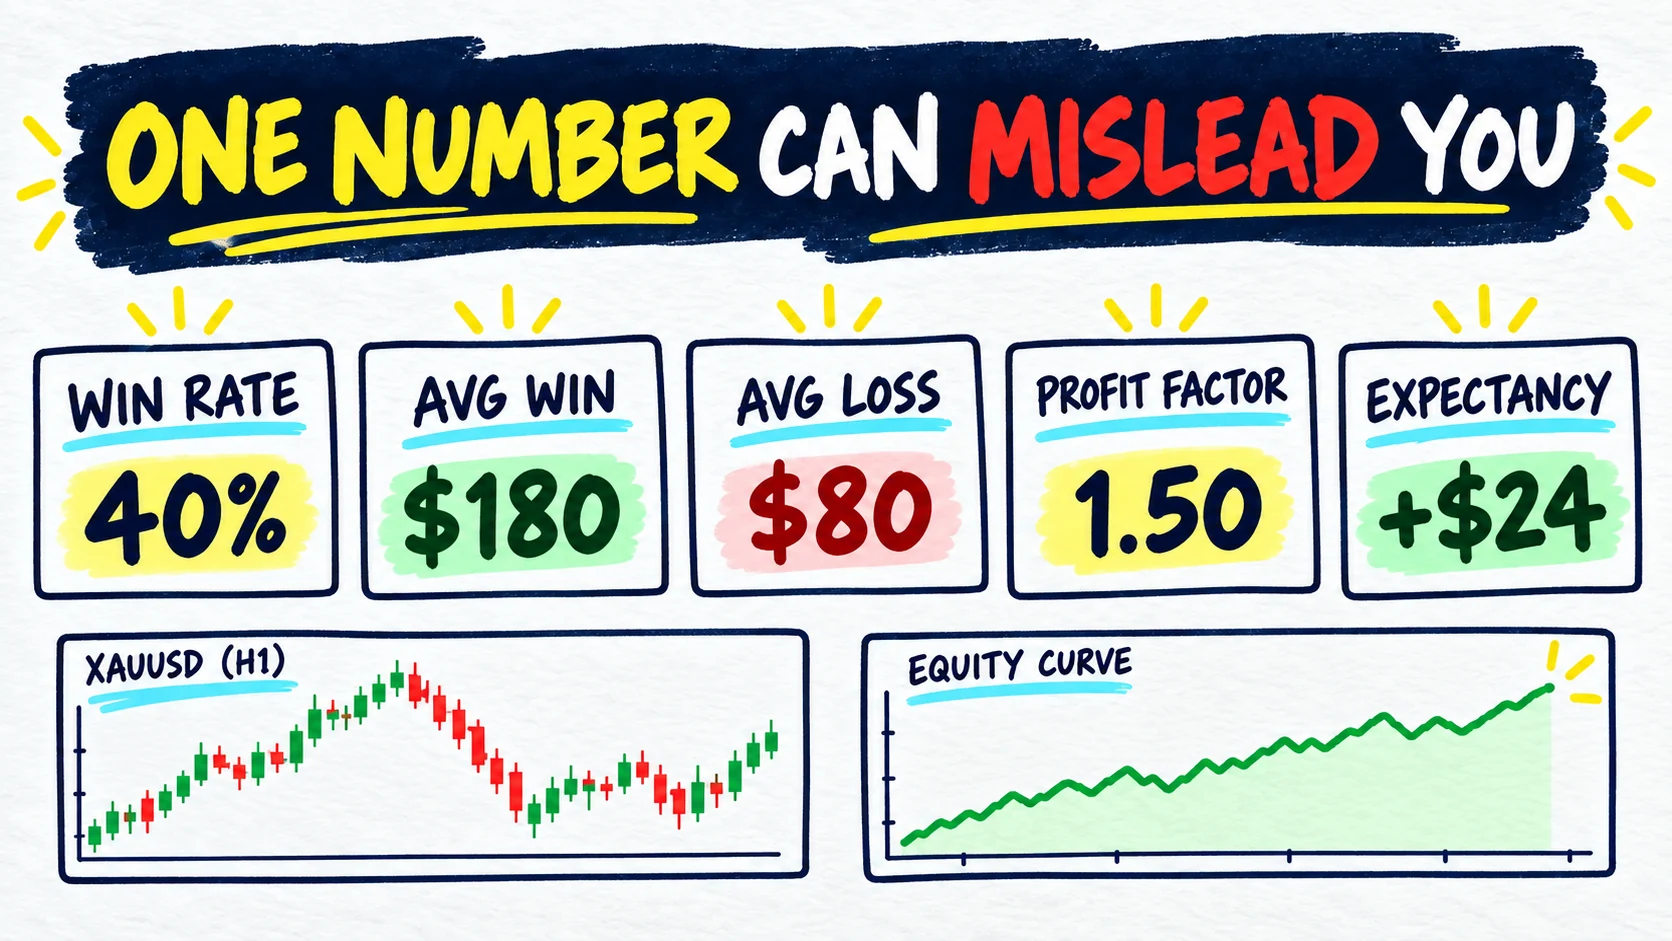
You open your journal after 20 XAUUSD trades. Your win rate is only 40%.
Your first thought may be: I am losing too often. My trading must be bad.
Then you notice something else. Your average winning trade is much larger than your average losing trade. The same sample has a profit factor above 1 and positive expectancy.
So which number should you trust?
Quick answer: do not judge your trading from one number. First check the trades included in the sample. Then read win rate with average win and average loss. Use profit factor and expectancy to summarise the same trades. Finally, check drawdown and the equity curve to see how the result happened.
These are historical measurements. They describe the trades you logged. They do not predict your next trade or guarantee that the same result will continue.
Which trading performance metric should you trust?
Trust the numbers only after you understand what each one measures and confirm that they all use the same data.
| Metric | Question it answers | What it cannot tell you alone |
|---|---|---|
| Net P&L | How much did this group of trades gain or lose after the costs you included? | Whether the result came from repeatable decisions or one unusual trade |
| Win rate | How many closed trades finished positive? | How large the wins and losses were |
| Average win and loss | How large was a typical winning or losing result? | How often each result happened |
| Profit factor | How much total winning money was recorded for each dollar of losing money? | The order of the trades or the size of the drawdown |
| Expectancy | What was the average result per trade in this sample? | What the next trade will do |
| Drawdown | How far did the account fall from a previous high? | Why the decline happened |
| Equity curve | What path did the running result take? | Whether your trade decisions followed your plan |
One metric fills a gap left by another. That is why the numbers should be read together.
Start by checking the data behind the numbers
Before you calculate anything, define the sample.
Write down:
- the account and date range;
- the number of closed trades;
- how breakeven trades were counted;
- whether partial exits were grouped as one trade;
- whether commission, spread, swap and other costs are already included;
- the currency used;
- the setup tags; and
- the session tags.
Do not compare a gross result from one report with a net result from another. Do not calculate win rate from 20 trades and profit factor from 18 trades. If the data boundary changes, the comparison becomes confusing.
The fictional example in this guide uses 20 closed XAUUSD trades. Every result is in USD and already includes the costs recorded for that trade. The journal contains London-session liquidity-sweep setups and New York-session breakout setups.
If your journal is incomplete, fix the records before trusting the report. The trading journal template shows the fields that make this later review possible.
What does win rate tell you?
Win rate is the percentage of closed trades that finished with a positive result.
In this fictional sample:
8 winning trades ÷ 20 closed trades × 100 = 40% win rate
That answer is correct, but it is incomplete.
A $20 win and a $500 win both count as one winning trade. A $20 loss and a $500 loss both count as one losing trade. Win rate counts outcomes. It does not measure their size.
This is why a high win rate can still finish negative, and a lower win rate can still finish positive. You need the next pair of numbers.
Why must you compare average win and average loss?
Average win and average loss show the typical size of each side of the sample.
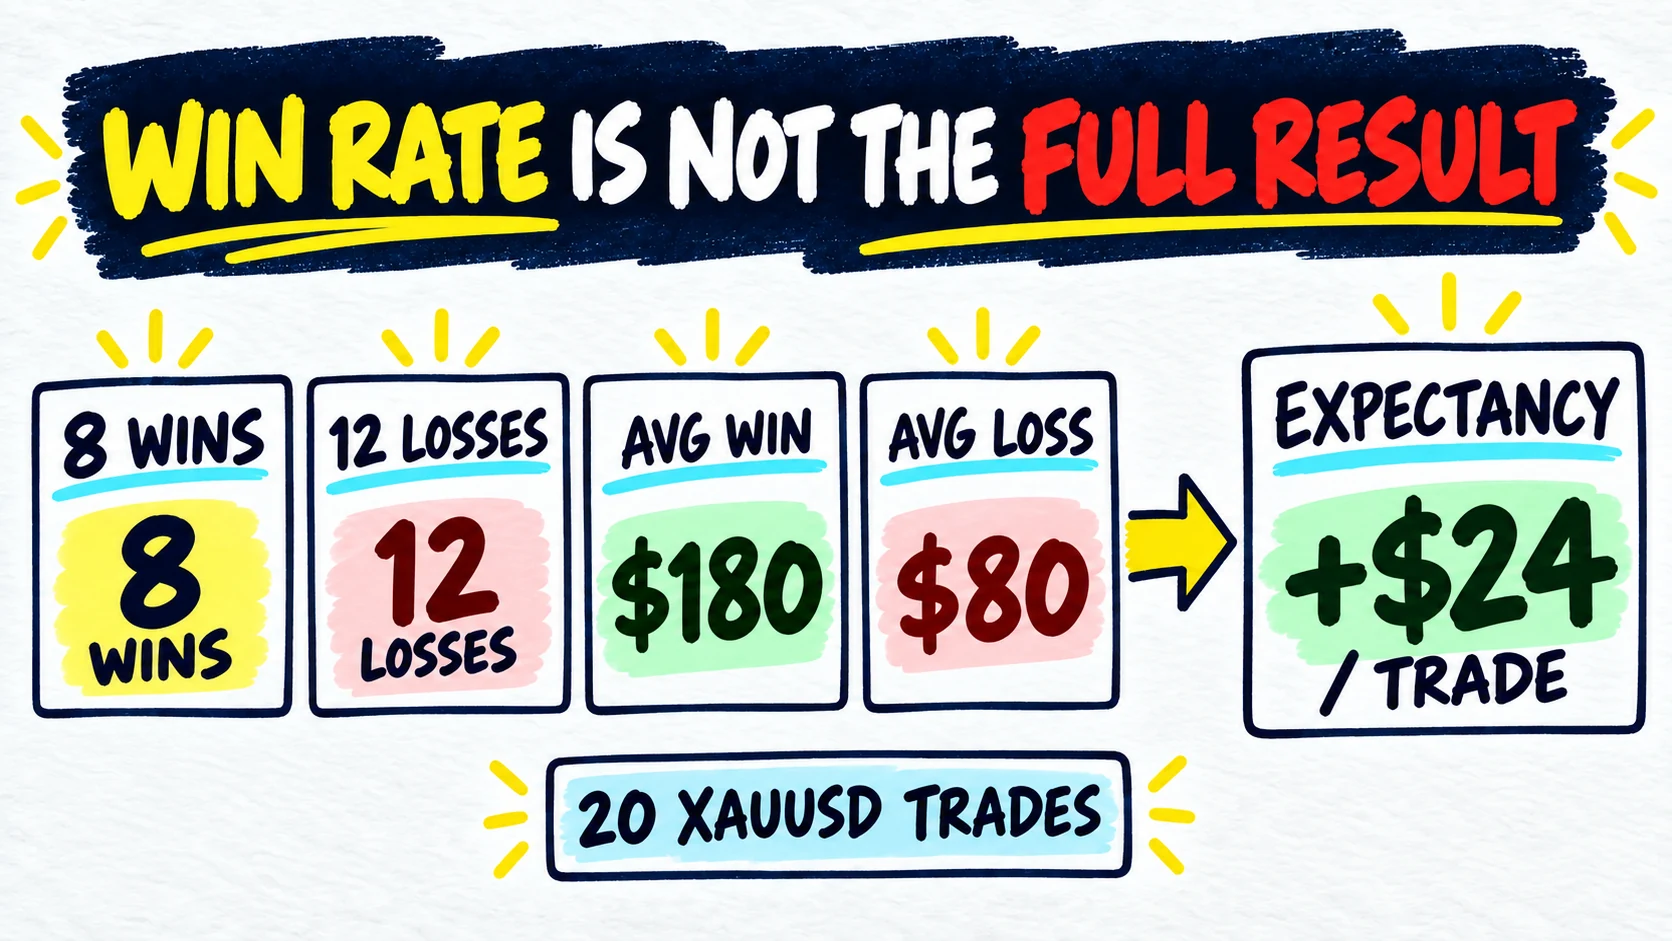
Our fictional trader has:
- 8 wins with an average net result of
$180; - 12 losses with an average net loss of
$80.
The totals are:
8 × $180 = $1,440 total winning amount
12 × $80 = $960 total losing amount
So the full 20-trade result is:
$1,440 − $960 = +$480
The trader lost more trades than they won, but the winning trades were larger. The 40% win rate did not show that relationship.
This does not mean a 40% win rate or a particular win-to-loss size is a good universal target. It only explains this defined sample.
What does profit factor add?
Profit factor compares the total winning amount with the absolute total losing amount.
For the same 20 trades:
$1,440 ÷ $960 = 1.50 profit factor
A result above 1 means the winning total was larger than the losing total for that sample. A result below 1 means the losing total was larger.
Profit factor is useful because it combines frequency and size into one ratio. But it still hides the order of the trades. Two traders can have the same profit factor while one experienced a small decline and the other came close to an account limit.
It can also move sharply when the sample is small or one trade is much larger than the rest. Always keep the trade count beside it.
What does trading expectancy mean?
Expectancy is the average result per trade in the selected historical sample.
Use the win rate, loss rate, average win and average loss from the same trades:
(40% × $180) − (60% × $80)
$72 − $48 = +$24 per trade
You can check the arithmetic against the total result:
20 trades × $24 = +$480
Both paths reach the same answer because they use the same clean sample.
Positive historical expectancy does not mean your next trade should make $24. Some trades may win, some may lose, and the future distribution may change. The number only says that the recorded sample averaged positive $24 per closed trade.
Use the trading expectancy calculator when you want to enter your own trade counts, average win, and average loss and see both formulas calculated from the same sample.
A 20-trade XAUUSD example: all four numbers together
Here is the complete fictional sample in one place:
| Check | Calculation | Result |
|---|---|---|
| Win rate | 8 ÷ 20 × 100 | 40% |
| Average win | $1,440 ÷ 8 | $180 |
| Average loss | $960 ÷ 12 | $80 |
| Profit factor | $1,440 ÷ $960 | 1.50 |
| Expectancy | (0.40 × $180) − (0.60 × $80) | +$24 per trade |
| Net result | $1,440 − $960 | +$480 |
The calculations agree. That is a useful data check.
But these six numbers still do not show whether the $480 arrived steadily, after one large decline, or mainly from one setup. For that, you need the path and the breakdown.
What do drawdown and the equity curve reveal?
Drawdown is the decline from a previous account high to a later low. An equity curve plots the running result across time or trade order.
Imagine the fictional trader reached +$420, then lost four trades and fell to +$100, before recovering to finish at +$480.
The final P&L is positive, but the path includes a $320 drawdown from the previous high.
That path matters because it can reveal:
- losses grouped in one session;
- several trades taken with different sizes;
- one setup producing most of the decline;
- a change after a winning or losing streak; or
- results moving close to a prop-firm loss limit.
The equity curve tells you where to look. Your journal notes, screenshots, setup tags and rule-adherence records help you understand what happened there. Use the firm’s current platform and rules for any official limit or breach calculation.
Break the result down by setup and session
The combined 20-trade sample may look positive while one group inside it is weak.
Split the same data by useful tags:
- London-session liquidity sweep;
- New York-session breakout;
- planned trade versus unplanned trade;
- rule followed versus rule missed; and
- calm, rushed or frustrated notes that you recorded yourself.
Suppose 12 London liquidity-sweep trades produced +$700, while 8 New York breakout trades produced −$220. The total remains +$480, but the breakdown gives you a clearer review question.
Do not jump from that small result to “London is always better” or “New York never works.” Ask whether the setup definitions were the same, whether the trades followed the plan, whether costs were included, and whether the sample is large enough to compare.
This is also why a full prop firm trading journal records the setup, session and decision process, instead of storing only P&L.
A simple order for reviewing your metrics
Use this order during a weekly or monthly review:
- Check the sample. Confirm the dates, closed trades, costs and counting rules.
- Read win rate with average win and loss. Frequency needs size.
- Check profit factor and expectancy. Confirm that both use the same trades.
- Inspect drawdown and the equity curve. Find where the path changed.
- Break the result down. Compare setups, sessions and your own rule-following tags.
- Write one review question. Choose one part of the record to investigate rather than changing everything from one report.
The weekly trading review template helps you turn this into a short routine. Use the monthly trading review template when you have a wider sample and want to compare periods.
The P&L calendar can also make clusters of winning and losing days easier to see.
When is your sample too small to judge?
There is no universal trade count that makes every result reliable.
Twenty trades can teach the formulas and may show a question worth reviewing. It is usually too little evidence for a strong conclusion about a strategy, setup or session.
Be careful when:
- one trade creates a large part of the total profit or loss;
- one setup has only a few examples;
- market conditions changed during the sample;
- position sizes were inconsistent;
- important costs are missing;
- breakeven trades were counted differently; or
- the sample mixes planned and unplanned trades.
Instead of asking, “Is this metric good?”, ask, “What exactly is included, and does the same pattern remain when I add more comparable trades?”
An optional Sharpe ratio may help advanced reviews compare return with variation, but it needs a clear return period and calculation method. Do not add it just because it looks professional. Start with the core numbers you can explain and verify.
How PropLogAI fits into performance review
When you log a trade in PropLogAI, you can record details such as the result, setup and session. Those user-entered records can support later comparisons inside your own journal.
PropLogAI helps organise the data. It does not turn a short sample into proof, predict your next trade, confirm a prop-firm rule, or tell you which setup to trade.
Use a performance report to keep the numbers, breakdowns, mistakes and next review question together. Keep the raw trades available so you can check any summary against the original records.
Frequently asked questions
Is a high win rate always better?
No. Win rate does not show the size of wins and losses. Read it with average win, average loss, profit factor and expectancy from the same trades.
Can a 40% win rate be positive?
Yes. In the fictional example, the average win is $180 and the average loss is $80. Eight wins and 12 losses produce a positive $480 result. Your own result depends on your own recorded trades and costs.
Is profit factor the same as expectancy?
No. Profit factor compares total winning money with total losing money. Expectancy shows the average result per trade in the selected sample.
Does positive expectancy mean the next trade should win?
No. Expectancy is an average from historical data. It does not predict the outcome of one future trade.
Should I compare London and New York sessions?
You can compare them when the tags, setup definitions, costs and sample boundaries are consistent. Treat a small difference as a review question, not proof that one session is always better.
Which metric should I check first?
Check the sample first. If the trades, costs or counting rules are inconsistent, every later metric can mislead you.
Start your trading journal
Track trades, understand your psychology, and get personalized AI coaching. No signals, no financial advice — just better self-review from your own data.
Get Started Free